Building a Modern Solar Energy Monitoring Dashboard: My Journey from Manual Logs to Real-Time Visualization

Eight years ago, I embarked on a journey into renewable energy with an off-grid solar setup. One of my primary goal from the start was to create a real-time energy monitoring dashboard that would provide a continuous visualization on the performance and output of each component of the system—energy generation, usage, and storage
This post covers my journey from manual data collection to an automated, state-of-the-art monitoring system using open-source tools like Emoncms, Node-RED, InfluxDB, and Grafana.
Starting Out: Manual Logging
In the early days, my monitoring setup was entirely manual. I used an EP Ever Tracer solar charge controller and relied on its companion PC app to export performance logs. This device maintained only 30 days of logs, which I downloaded as CSV files. These logs were then uploaded to PV Output, a website that helps visualize power usage and generation data. However, this setup had significant limitations:
- Post-fact data updates: Data was only available after it was logged.
- Manual effort: Downloading and formatting logs was a routine task.
Despite these challenges, I was committed to data tracking, knowing it would be vital in optimizing and understanding my solar setup.
First Step Toward Automation with EmonCMS

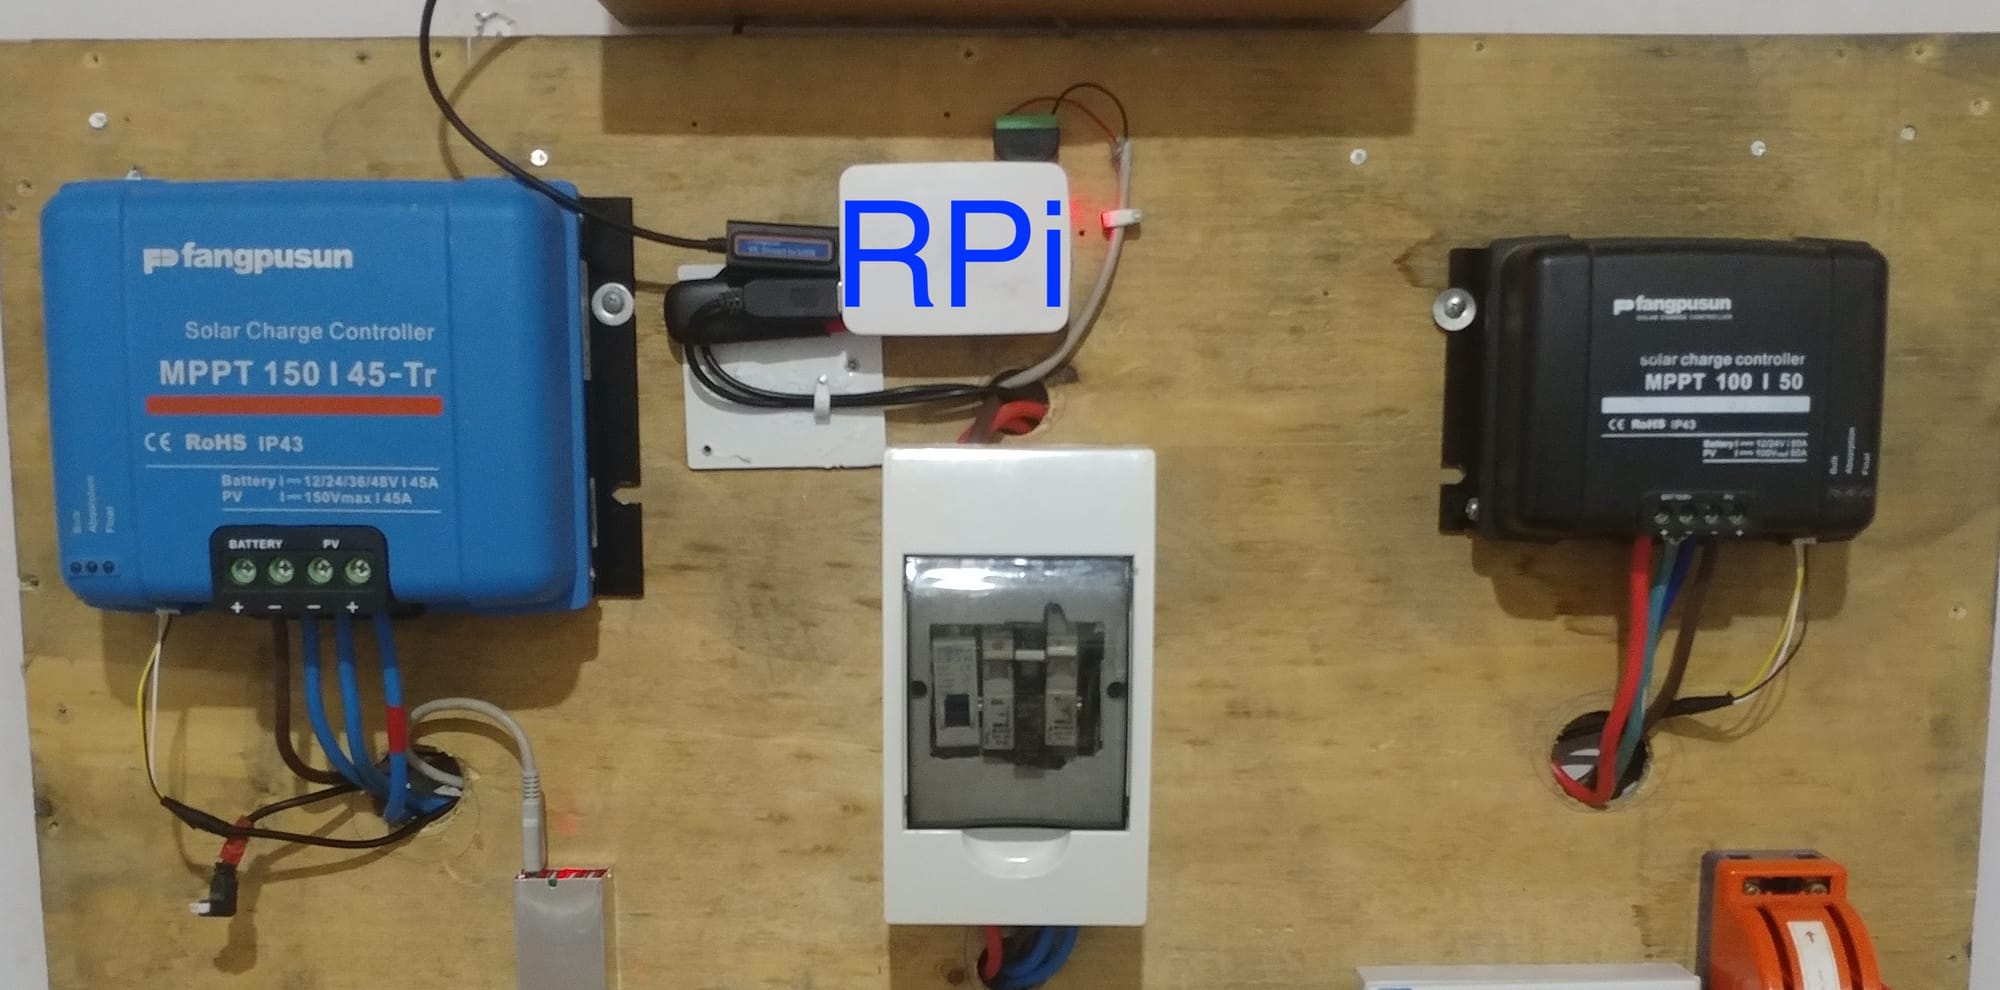
Two years later, in 2018, I automated my system logs for the first time. I set up a Raspberry Pi and configured it with EmonPi an open source energy monitoring stack developed by the good folks at openenergymonitor.org.
How It Worked:

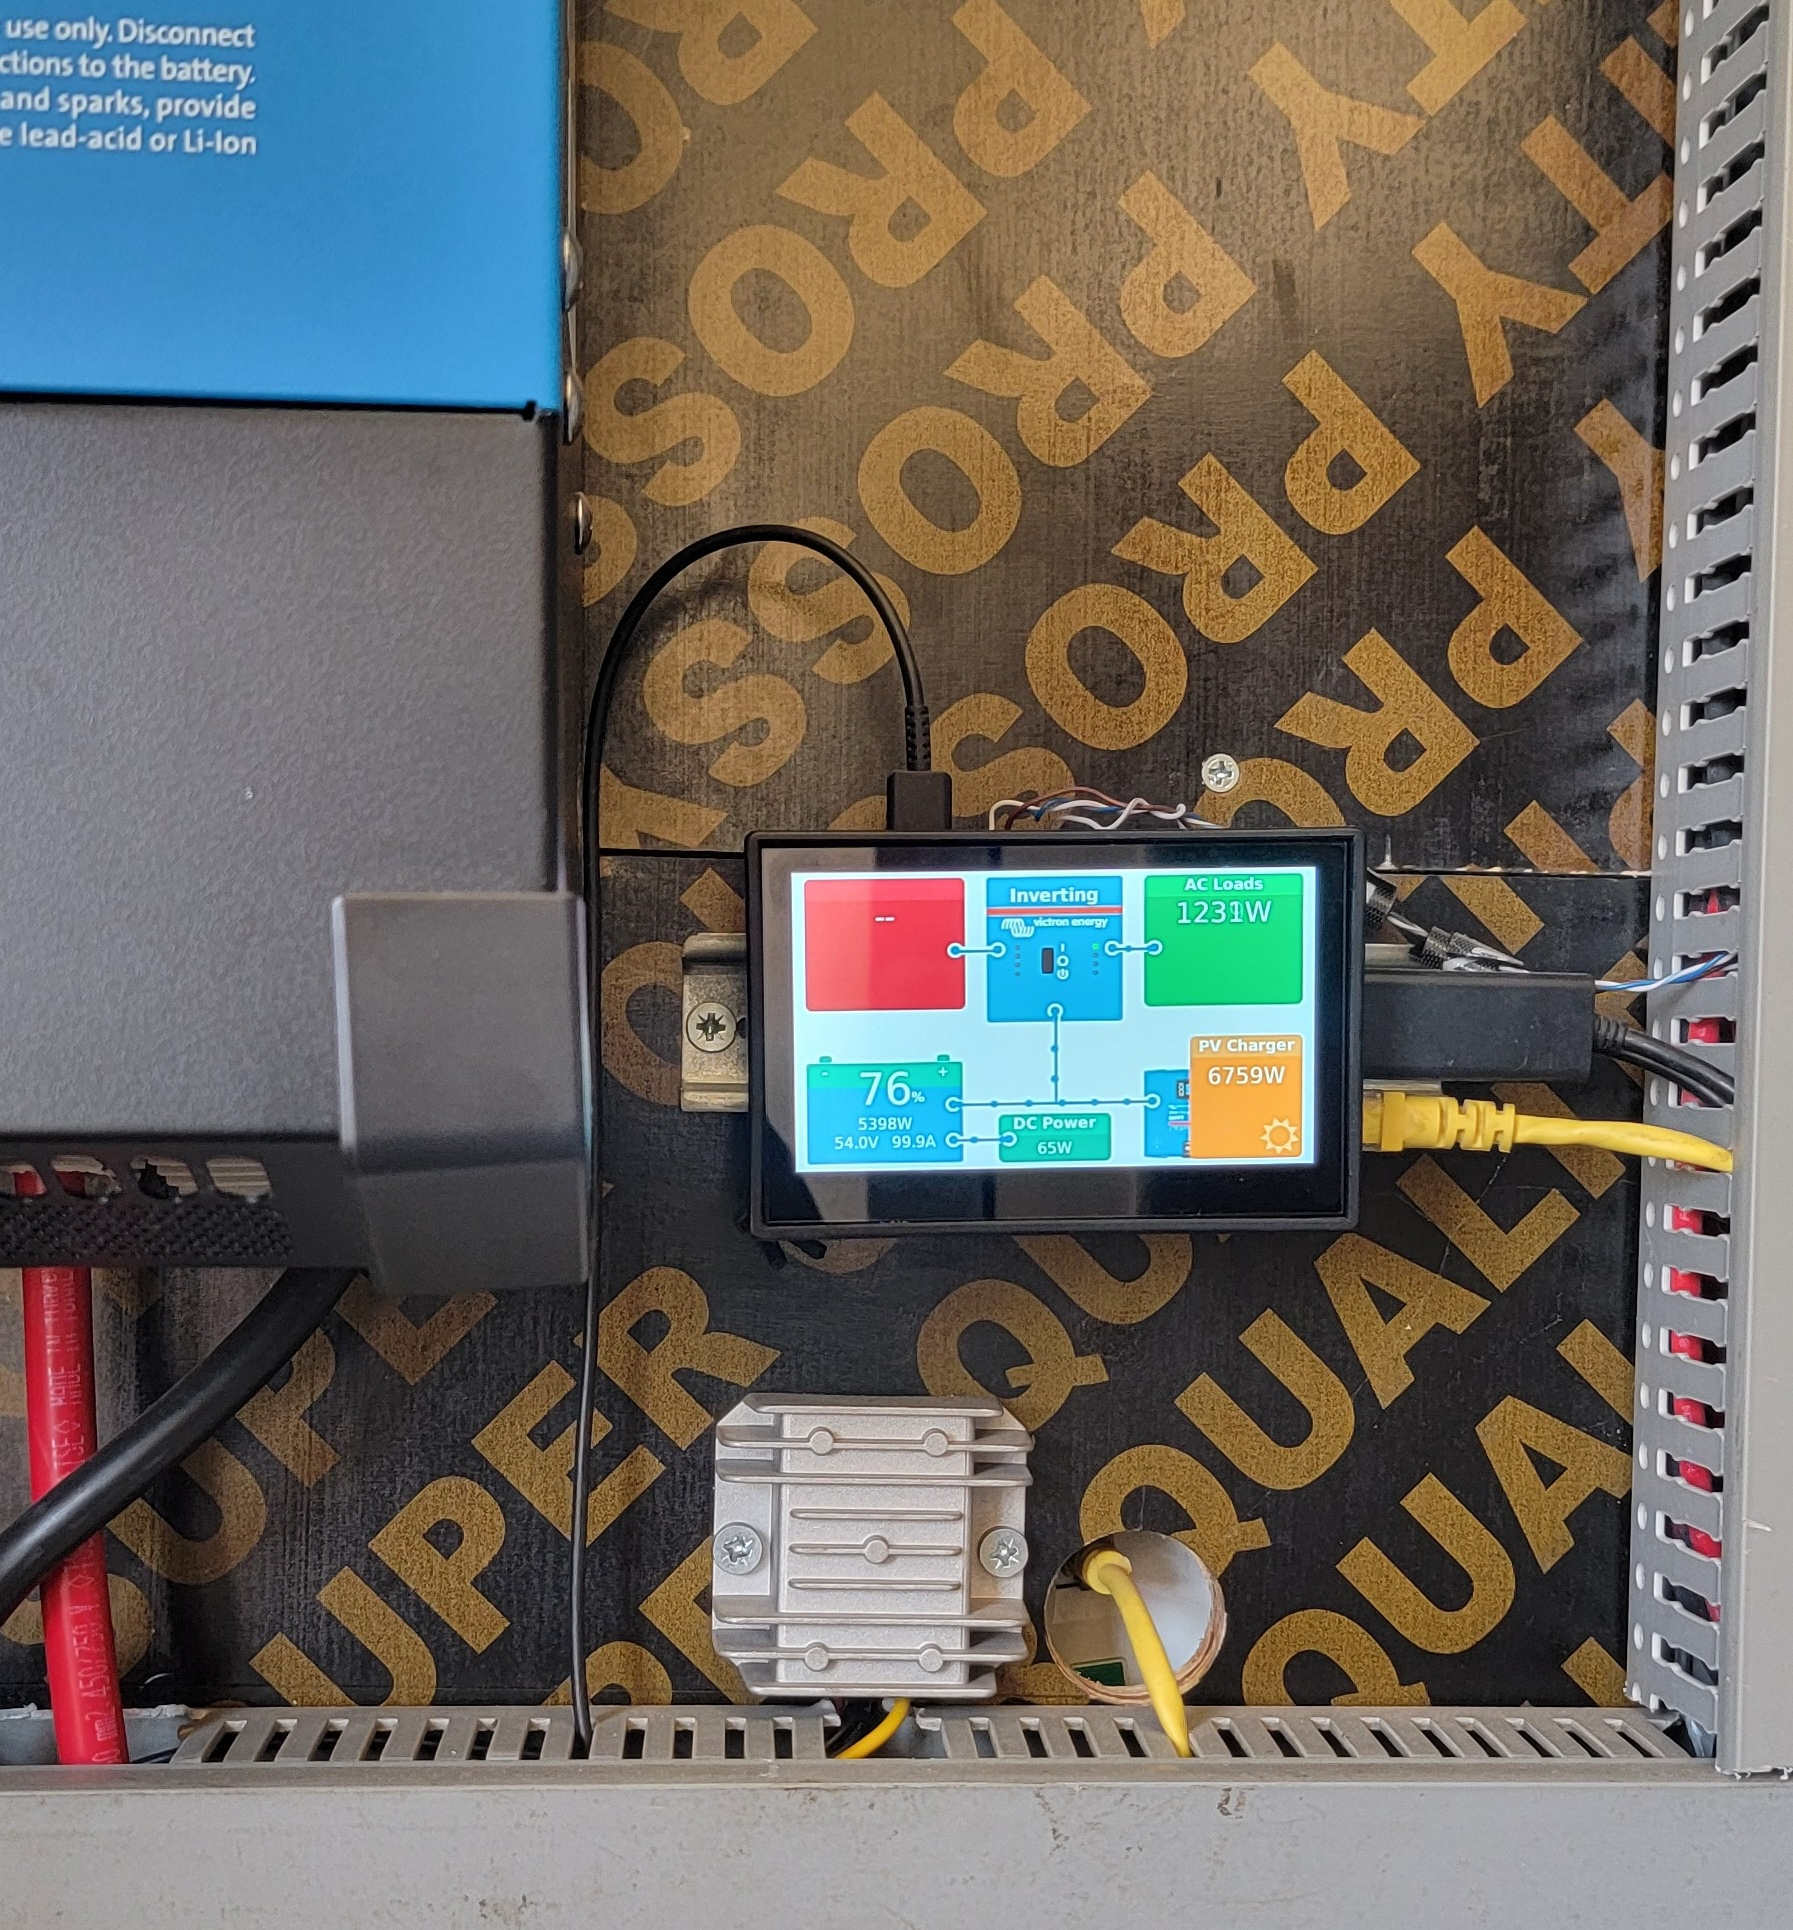
- Data Collection: The Raspberry Pi, physically connected to my inverter, solar charge controller, and battery monitor, (via different protocols like CAN, Modbus, RS458 etc) gathered key metrics like battery state, solar power output, and power usage etc.
- Data Processing: Using HTTP posts, the data was sent to my self-hosted EmonCMS instance.
- Visualization: EmonCMS processed this data, allowing me to visualize energy use by month, day, and year.
EmonCMS is incredibly powerful, offering historical insights into my energy system performance. For six years, it formed the backbone of my energy monitoring, giving me a reliable long-term view of power usage, generation and and overall system efficiency.
Current energy dashboard https://energy.openculture.org.ng/dashboard/view?id=49
Why EmonCMS Fell Short
While EmonCMS was robust and reliable, it had some major limitations:
- Outdated Interface: The dashboards weren’t optimized for modern web standards, especially mobile.
- Limited Customization: Lacked flexibility in design, making the mobile experience challenging.
Over time this short coming became pronounced and eventually I started to consider a replacing emoncms with something optimized for mobile, free, open-source, and supportive of data ownership and portability.
The Solution: A Modern Dashboard with Grafana, InfluxDB, and Telegraf (TIG Stack)

After some experimentation, I've Recently implemented a new monitoring solution that meets all my requirements: modern, mobile-optimized, and based on free and open-source software. The new system uses the TIG (Telegraf, InfluxDB, Grafana) stack:
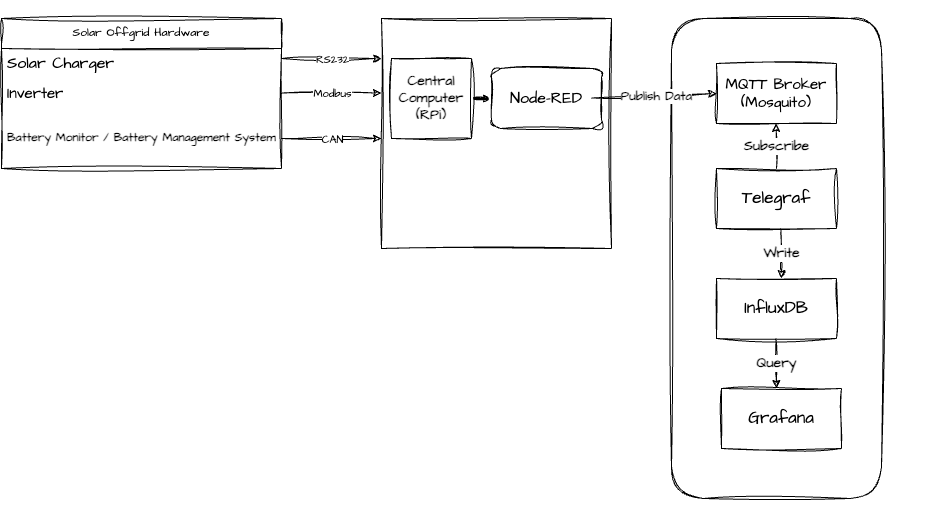
The Architecture

- Data Collection
- A central computer physically connects to my off-grid hardware using various protocols (CAN, Modbus, Serial 232)
- Node-RED (a flow-based programming tool) collects and sends data to an MQTT broker hosted in the cloud
- Data Processing and Storage
- Telegraf consumes the MQTT data
- InfluxDB stores the time-series data, acting as a powerful database optimized for IoT devices
- Visualization
- Grafana provides modern, responsive dashboards that work beautifully on both desktop and mobile devices
This new setup provides flexibility, scalability, and beautiful, modern dashboards that look great on any device.
The Public view for the dashboard is available here
What's Next
While this post provides a high-level overview of my setup, I plan to create a detailed, step-by-step guide showing how you can implement a similar system. The guide will include:
- Detailed hardware requirements
- Software installation and configuration
- Integration steps
- Dashboard setup and customization